Market Maps

The Market, Mapped

World Map, Market Pulse and Correlation Map — three live views of where money is moving, built to be seen, not read.
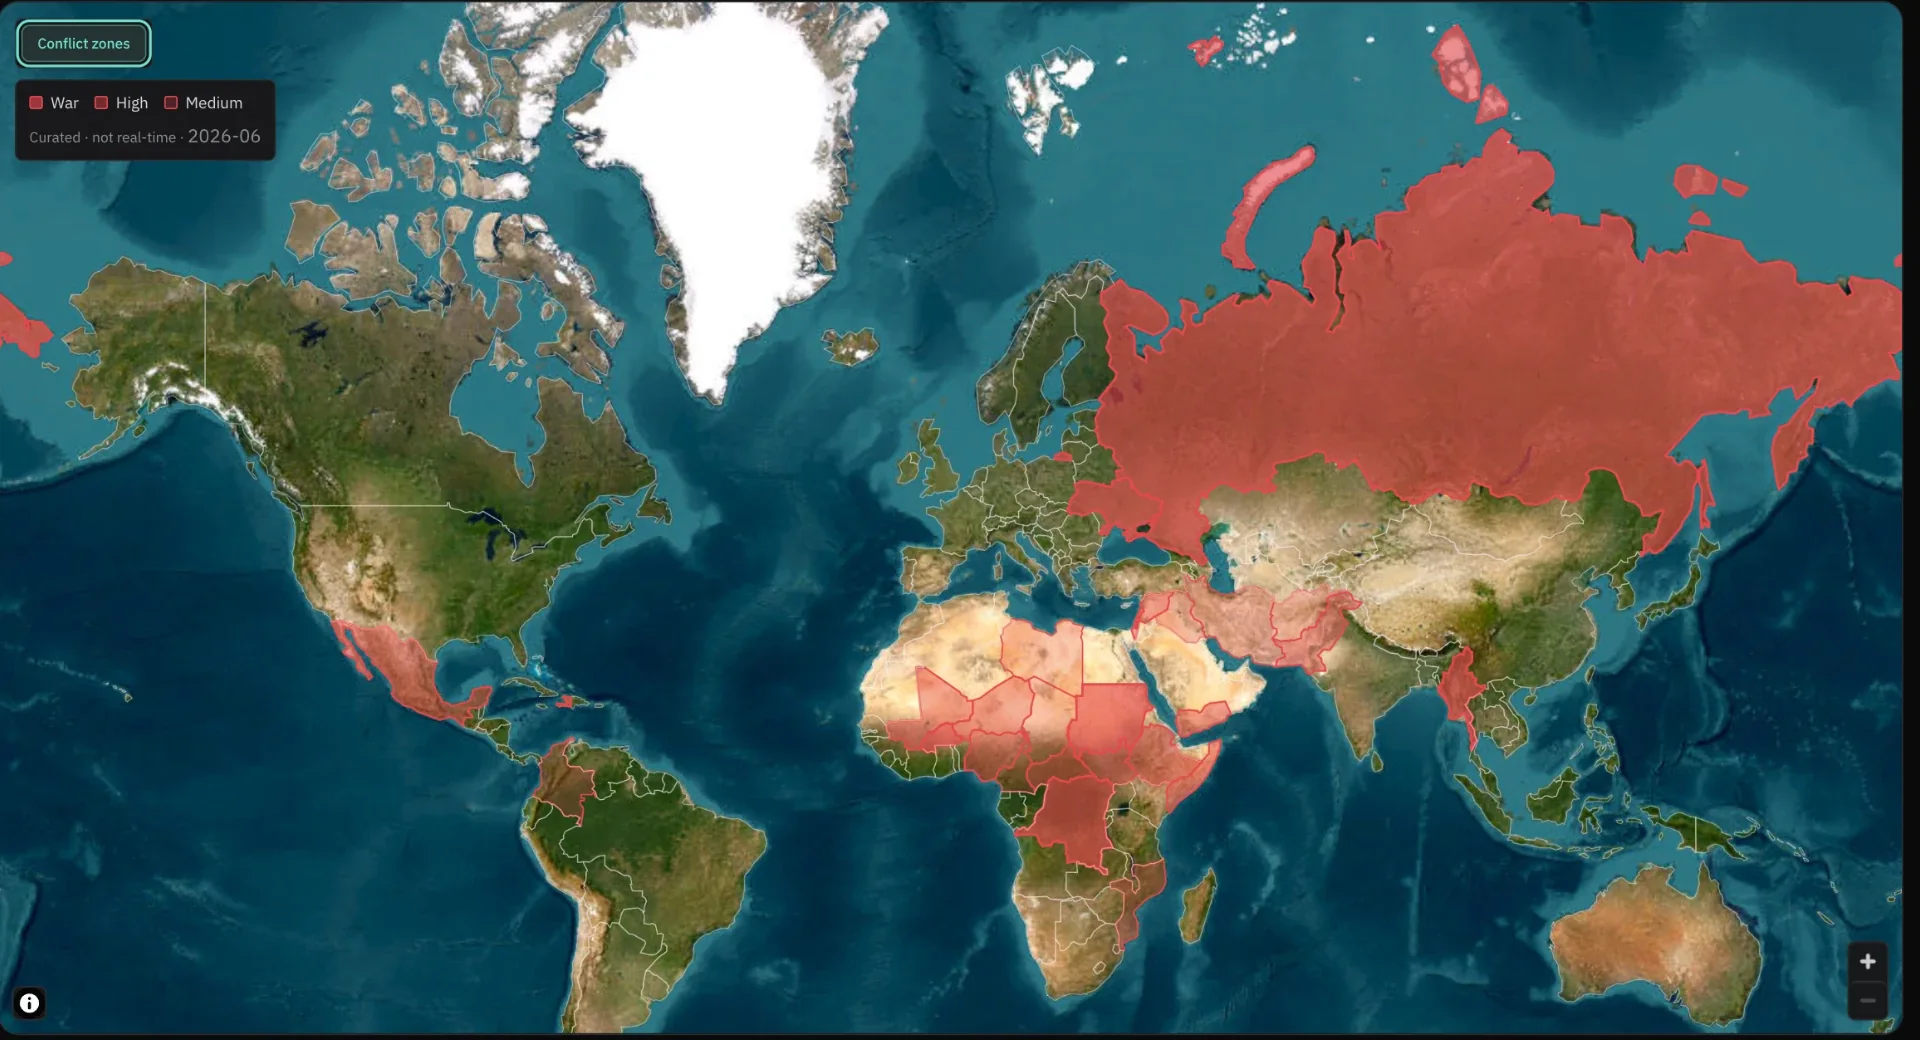
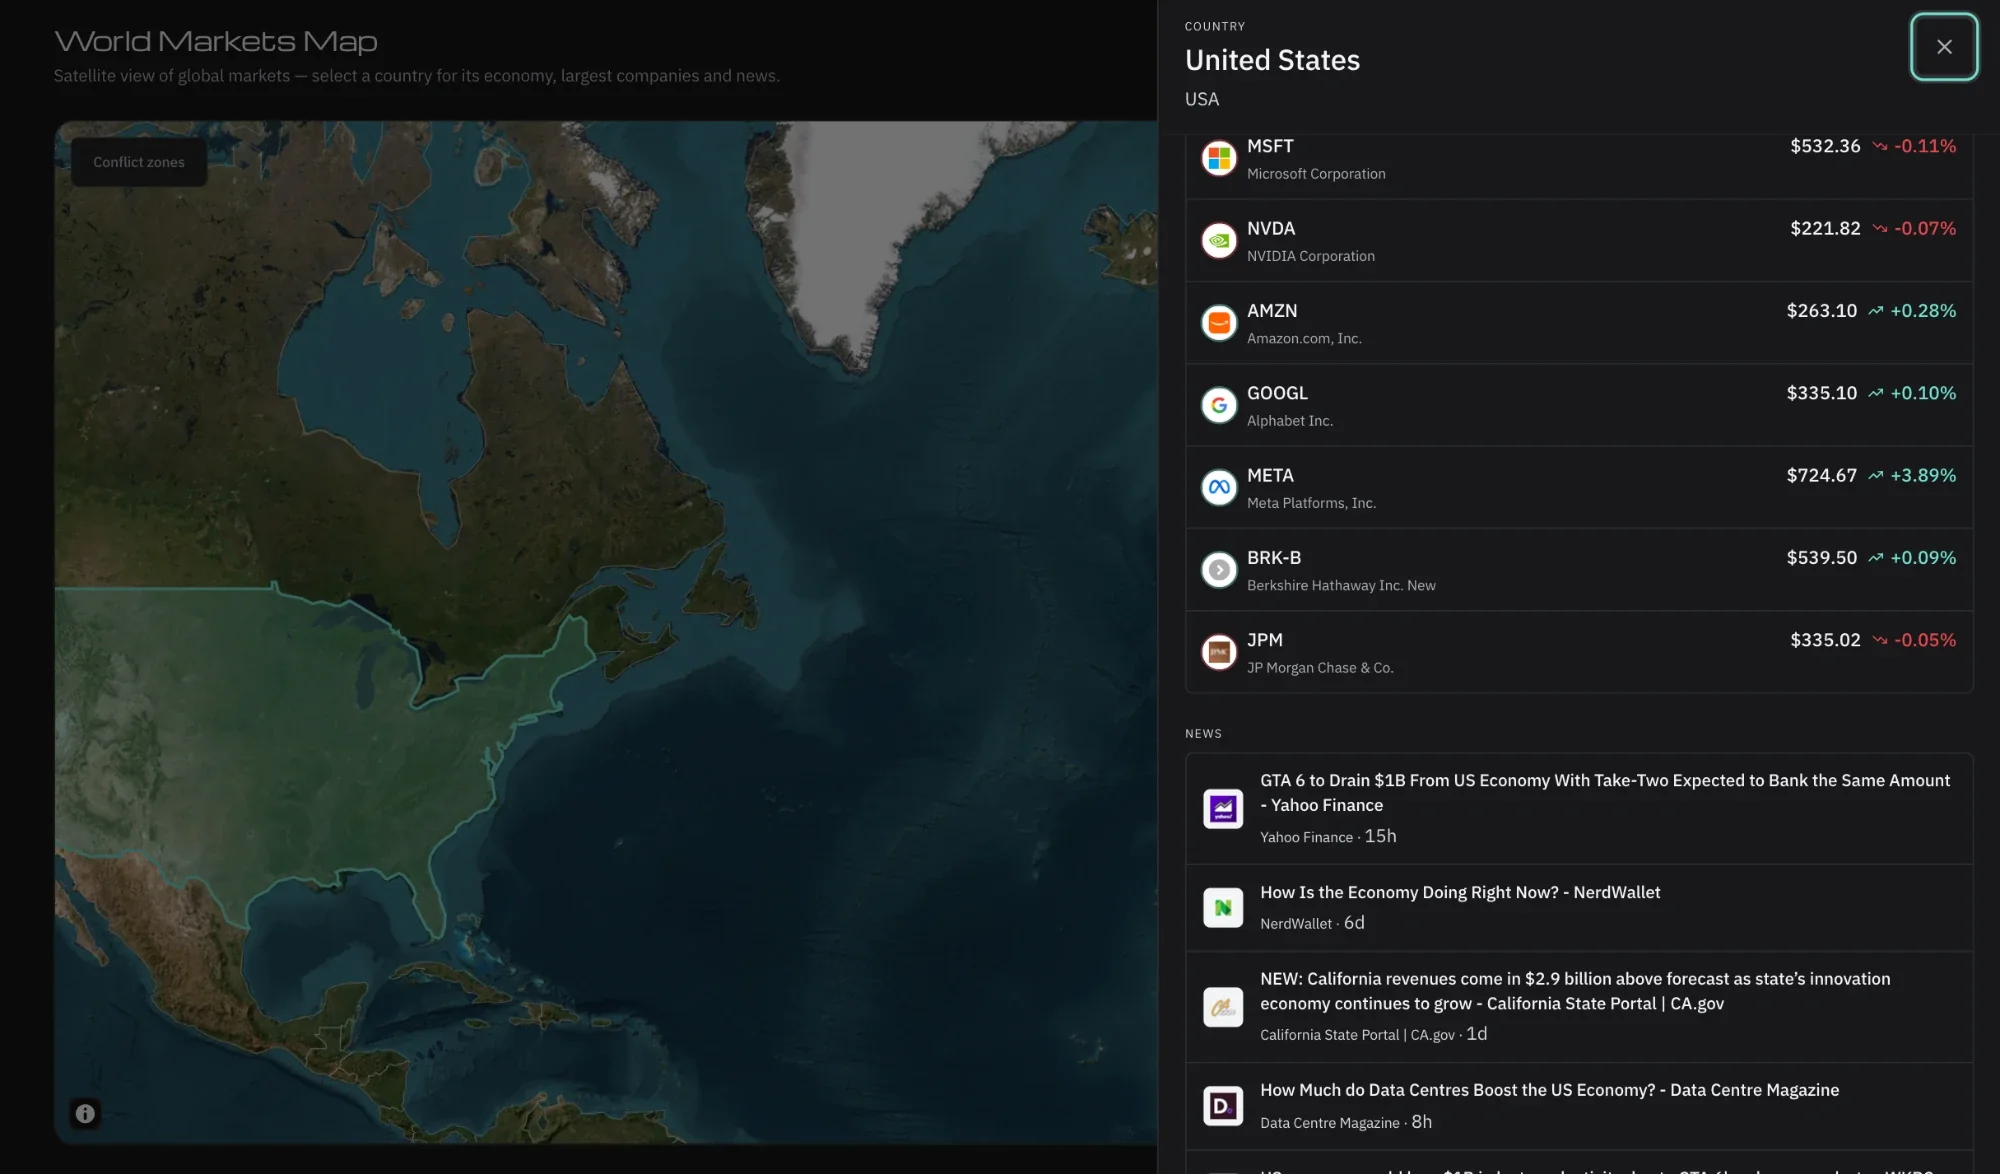
World Markets Map: a satellite view of every market, with conflict zones highlighted
01

The World as a Market


Tap a country: its economy, its biggest companies with today's prices, its news. From the map to the title in two taps. Pro.

  • Full-screen satellite mapOf the whole world, click or tap to open a country. World Markets Map: a satellite view of every market, with conflict zones highlighted Full-screen satellite map
  • A country's economyIts biggest companies, with live prices. A country opened on the World Markets Map: its largest companies with live prices and its news A country's economy
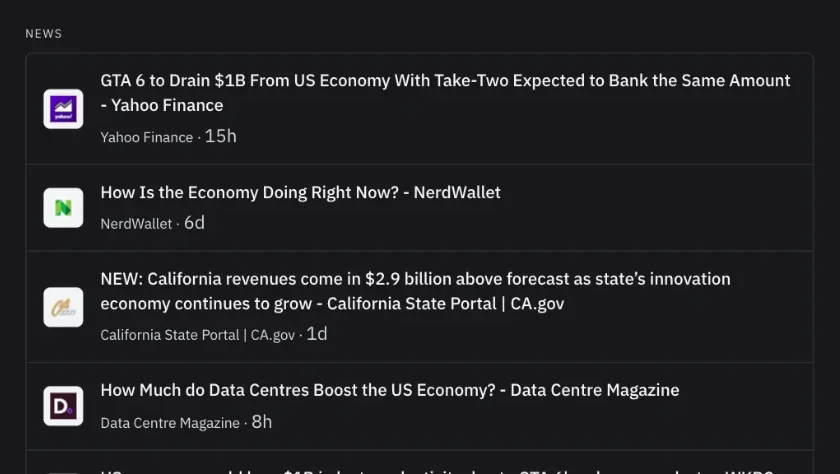
  • Its news, attachedLocal stories open from the same view. The news column of a country panel on the World Markets Map Its news, attached
  • Edge-to-edge on phoneThe map fills the screen to the physical edge. Placeholder · Video or photo Edge-to-edge on phone
A country opened on the World Markets Map: its largest companies with live prices and its news
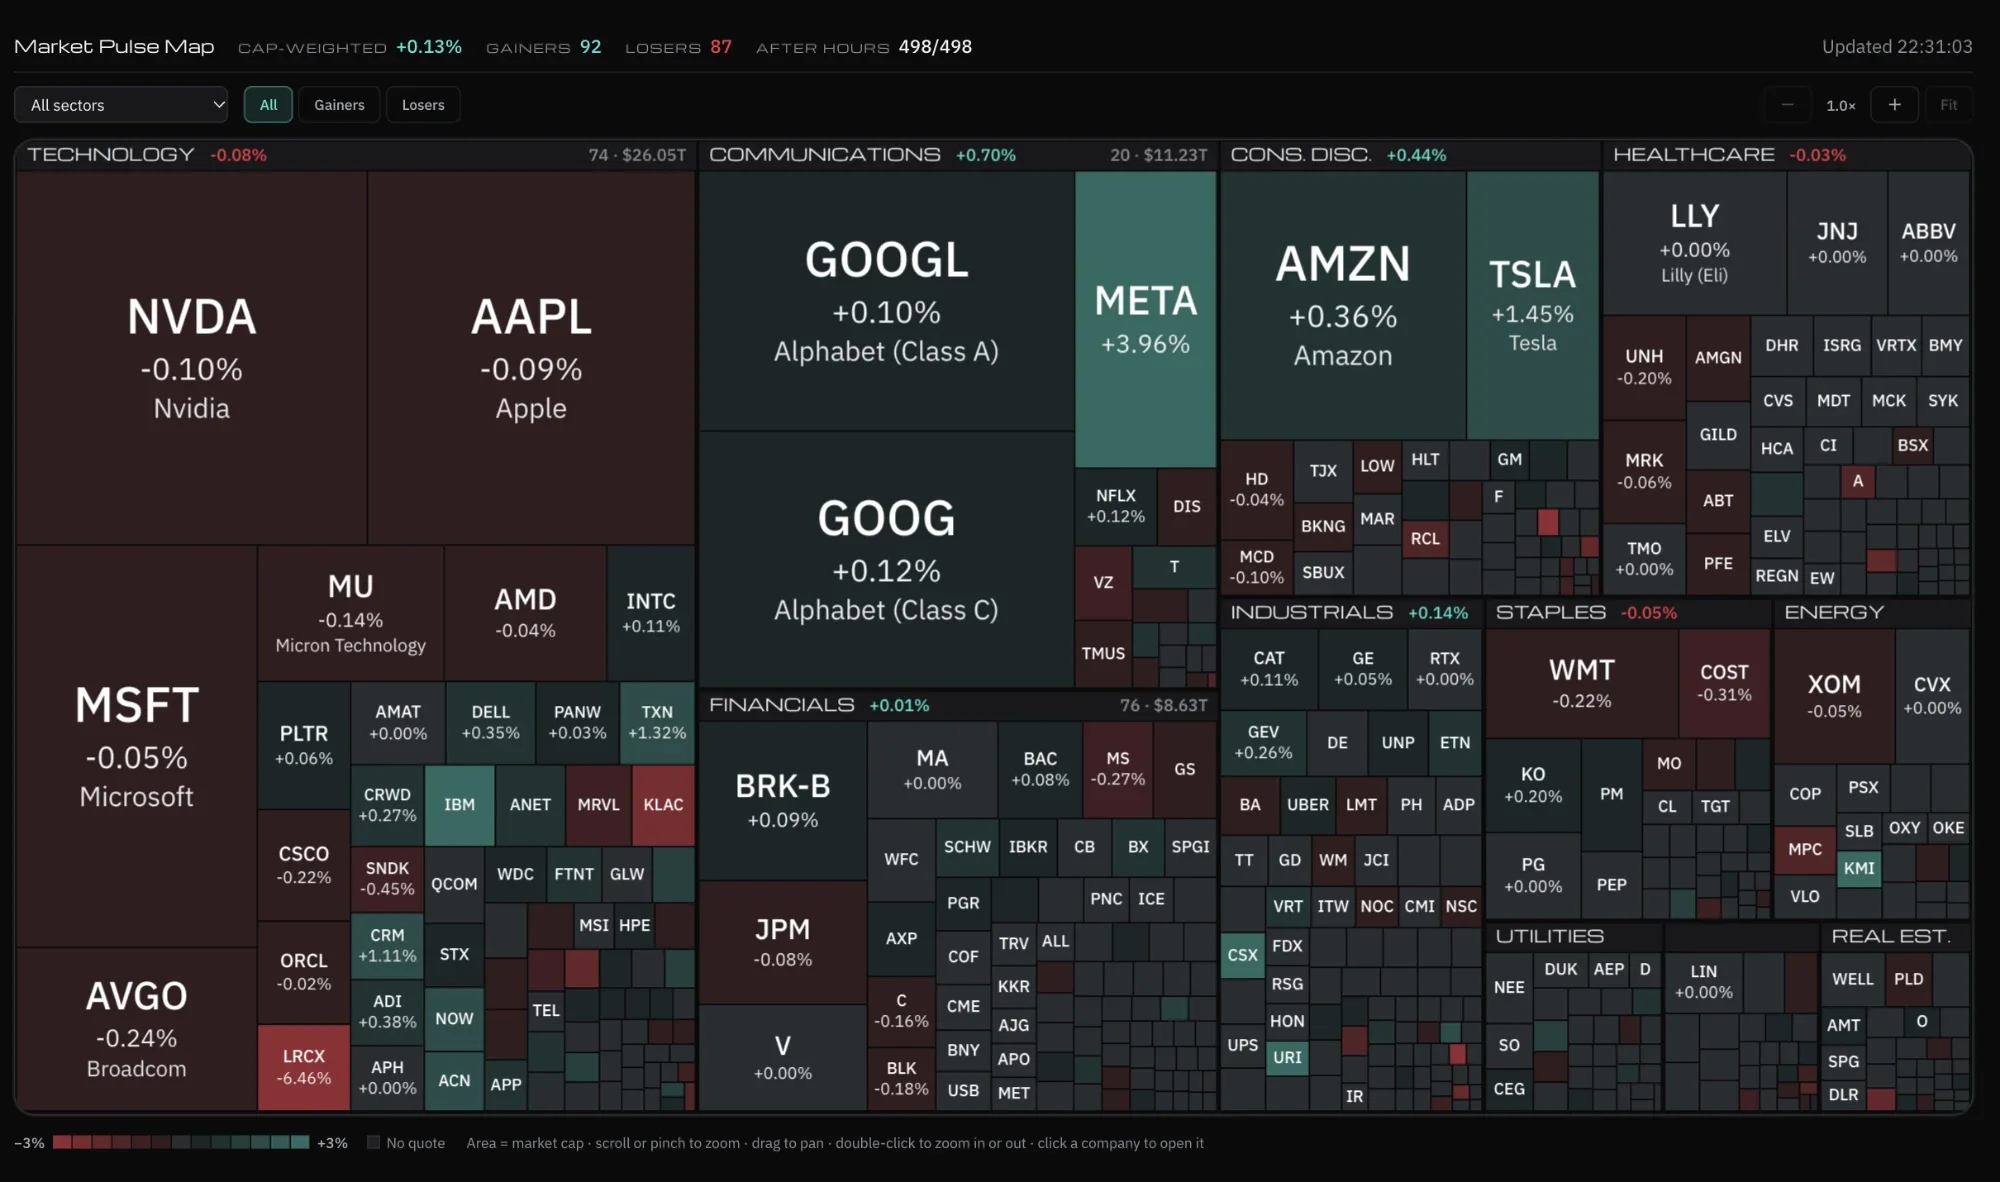
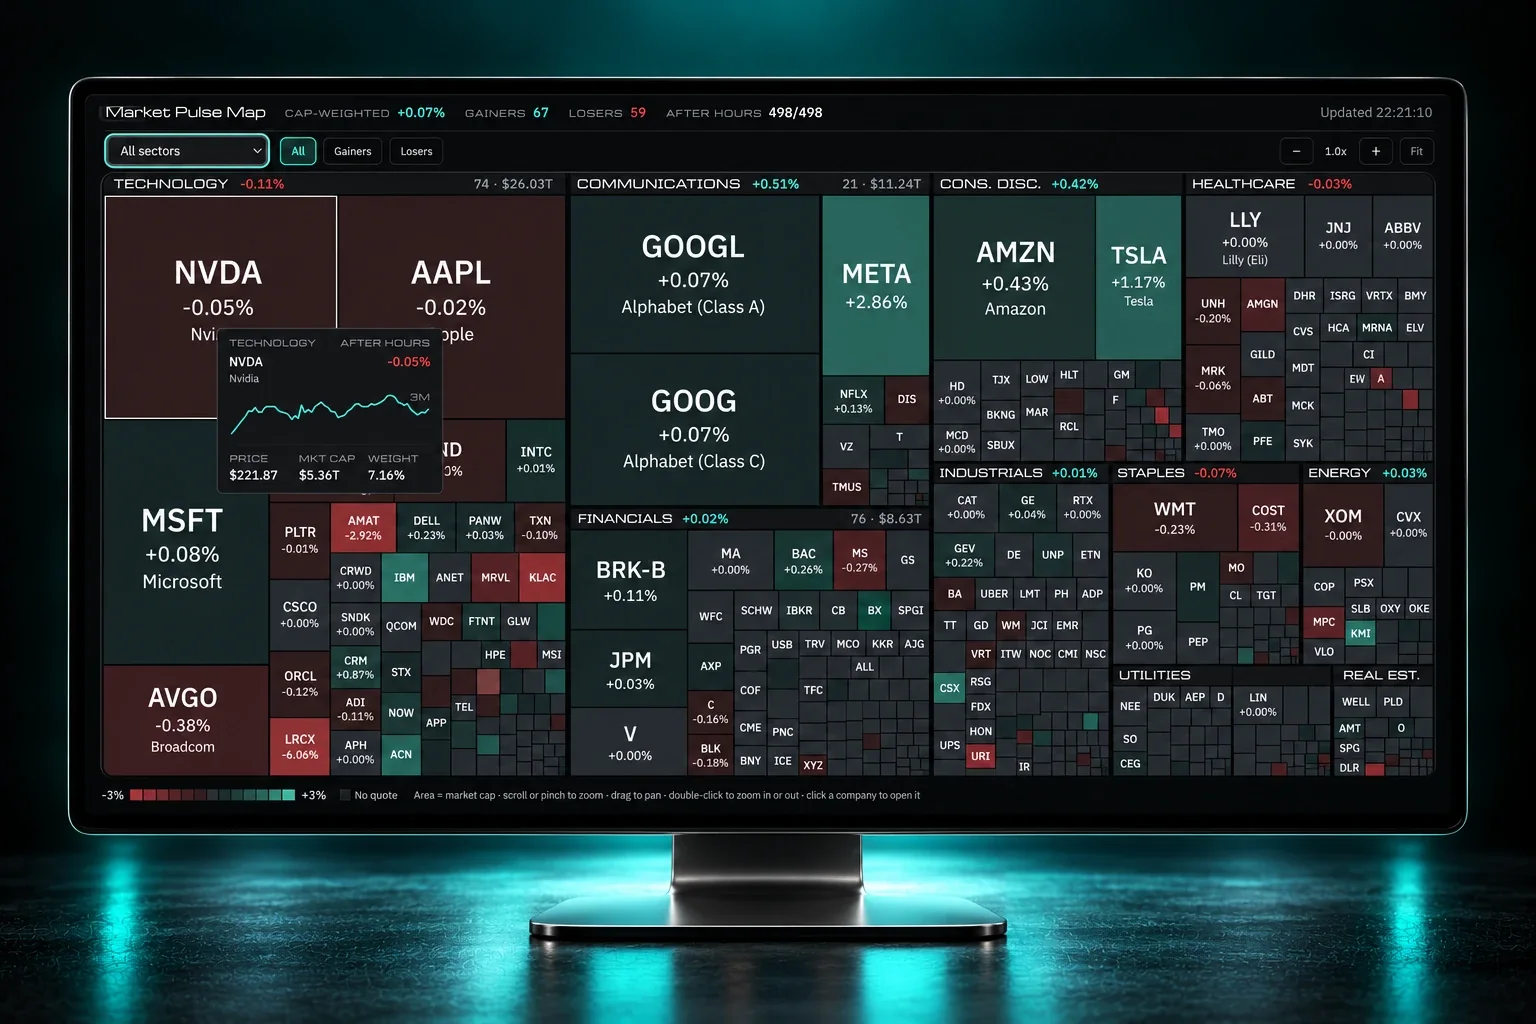
Market Pulse Map: the S&P 500 as tiles sized by market cap and coloured by the day's move
02

The S&P 500 in One Glance


Five hundred companies, each as big as it counts and colored by how it closed. Where there's green and where there's red is visible from a distance.

  • Five hundred companiesEvery box sized by its weight in the S&P 500. Market Pulse Map: the S&P 500 as tiles sized by market cap and coloured by the day's move Five hundred companies
  • Colored by the day's changeThe whole sector map readable at a glance. Market Pulse Map: the S&P 500 as tiles sized by market cap and coloured by the day's move Colored by the day's change
  • Click a tileOpens straight into the title panel. Placeholder · Video or photo Click a tile
  • StarterOne of the two maps that open at Starter. Placeholder · Video or photo Starter
03

What Moves With What


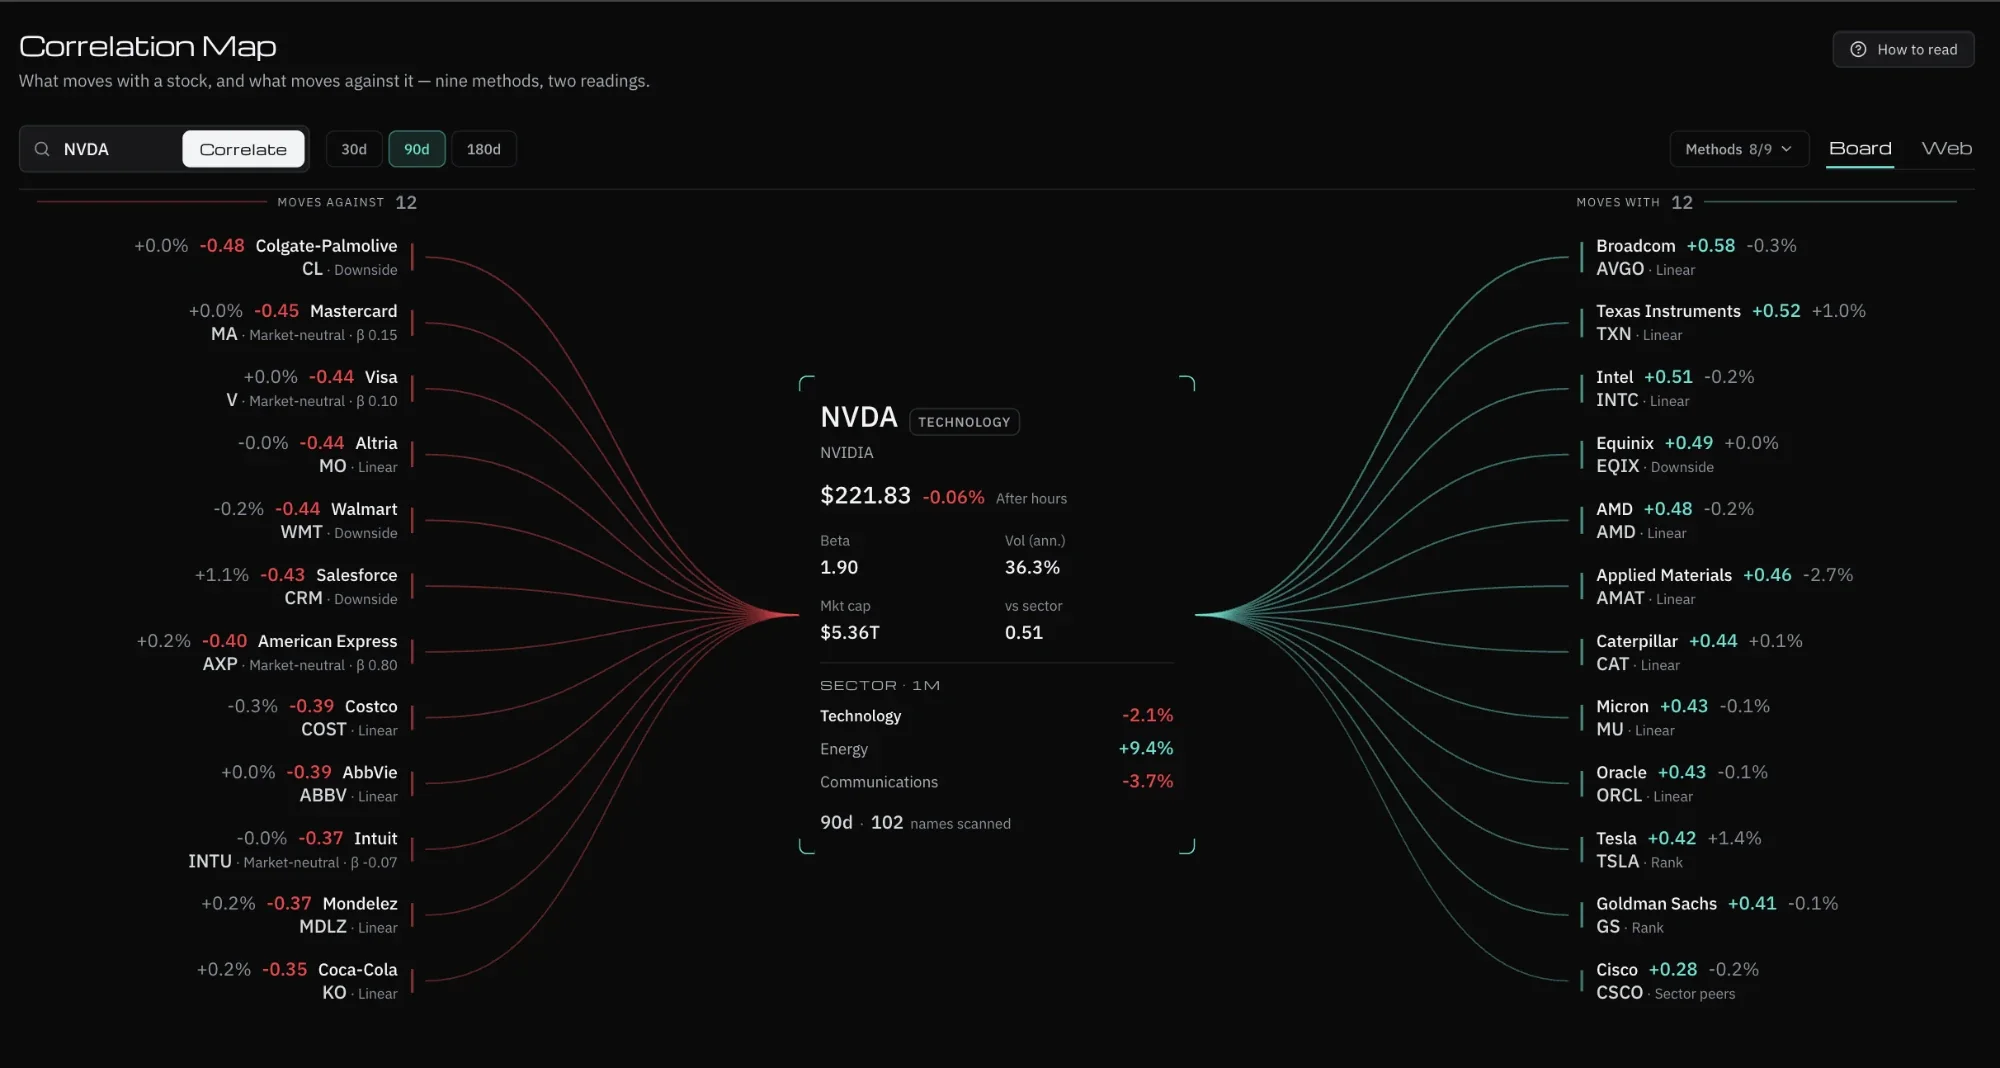
Type a ticker and see what's attached to it. It helps uncover that your portfolio is one bet written five ways.
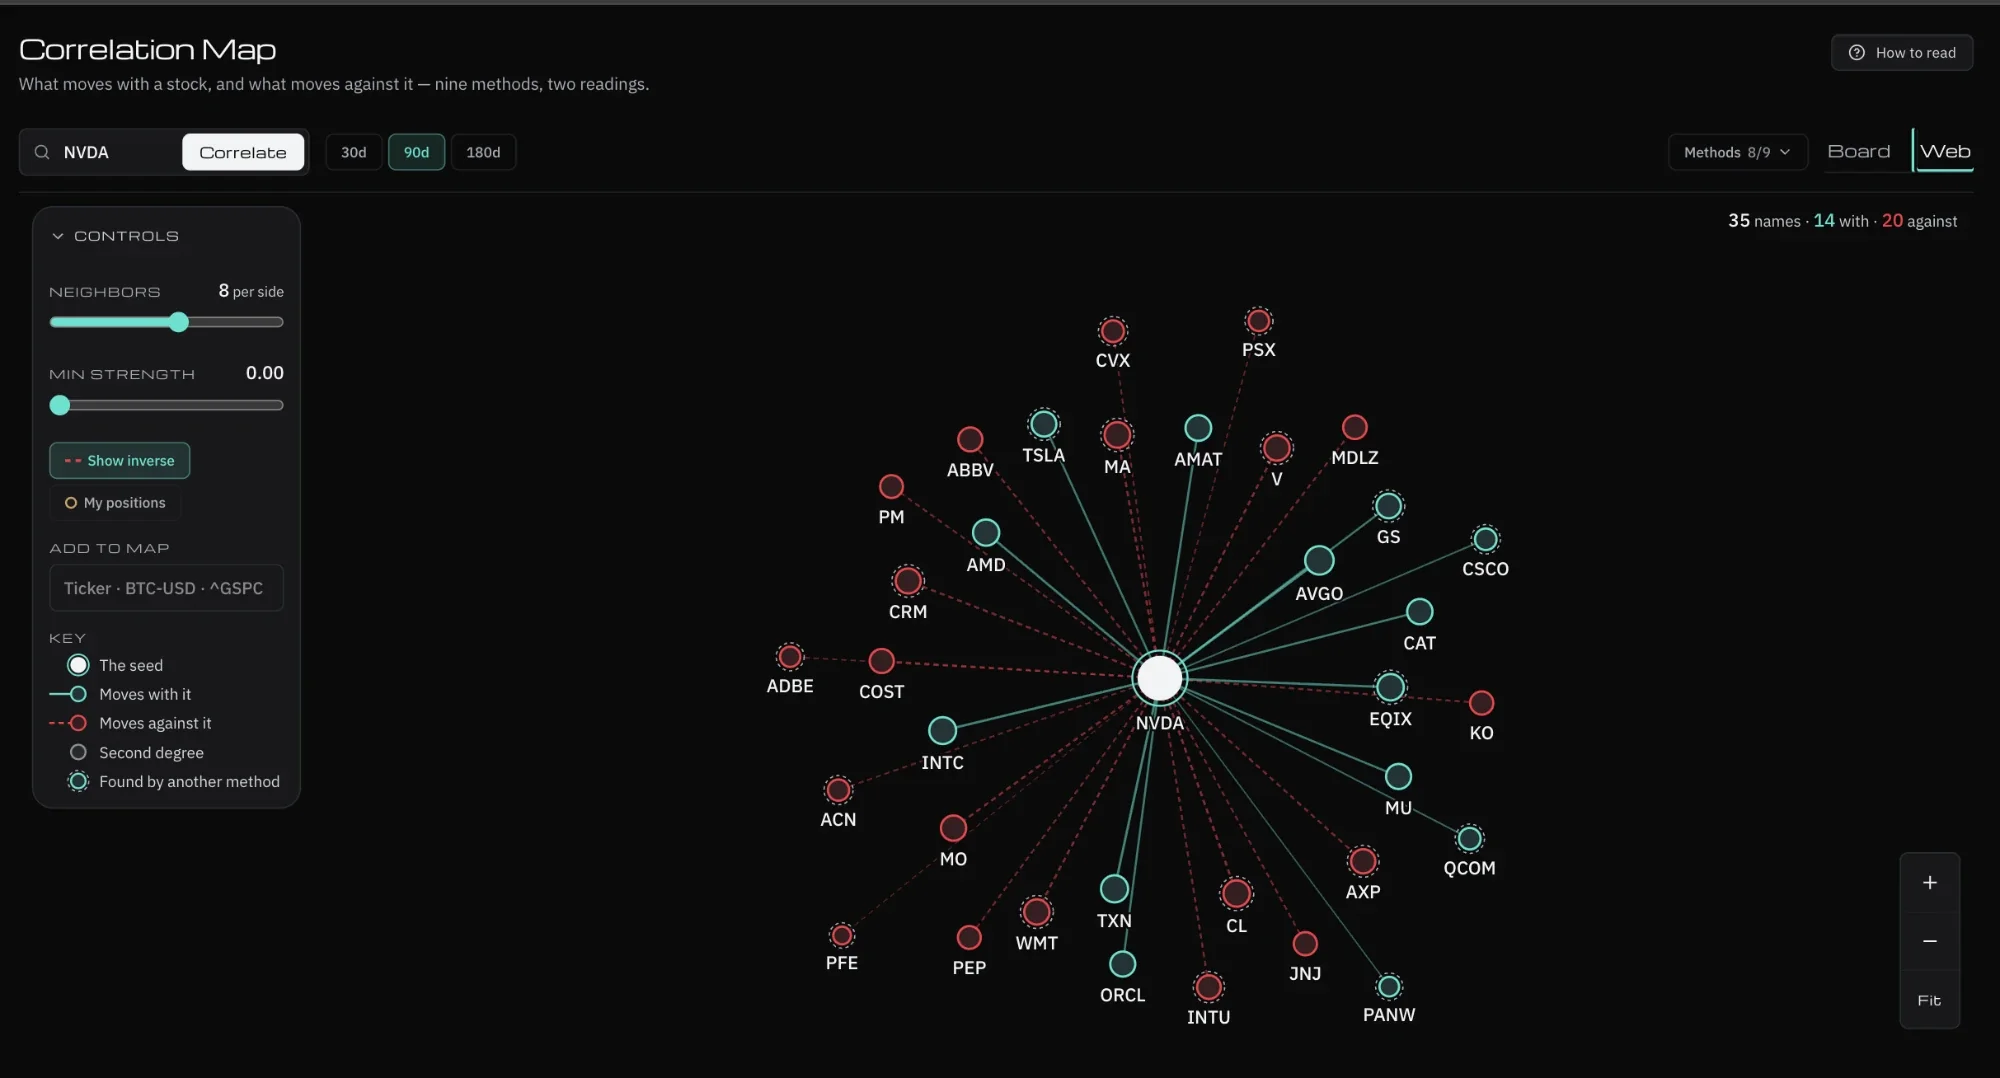
  • Force-directed graphOf correlations across the market. Correlation Map, web view: the seed in the centre, solid lines for names that move with it, dashed for names that move against it Force-directed graph
  • Type a tickerSee what moves with it, and what moves against it. Correlation Map, board view: what moves with a stock on the right, what moves against it on the left Type a ticker
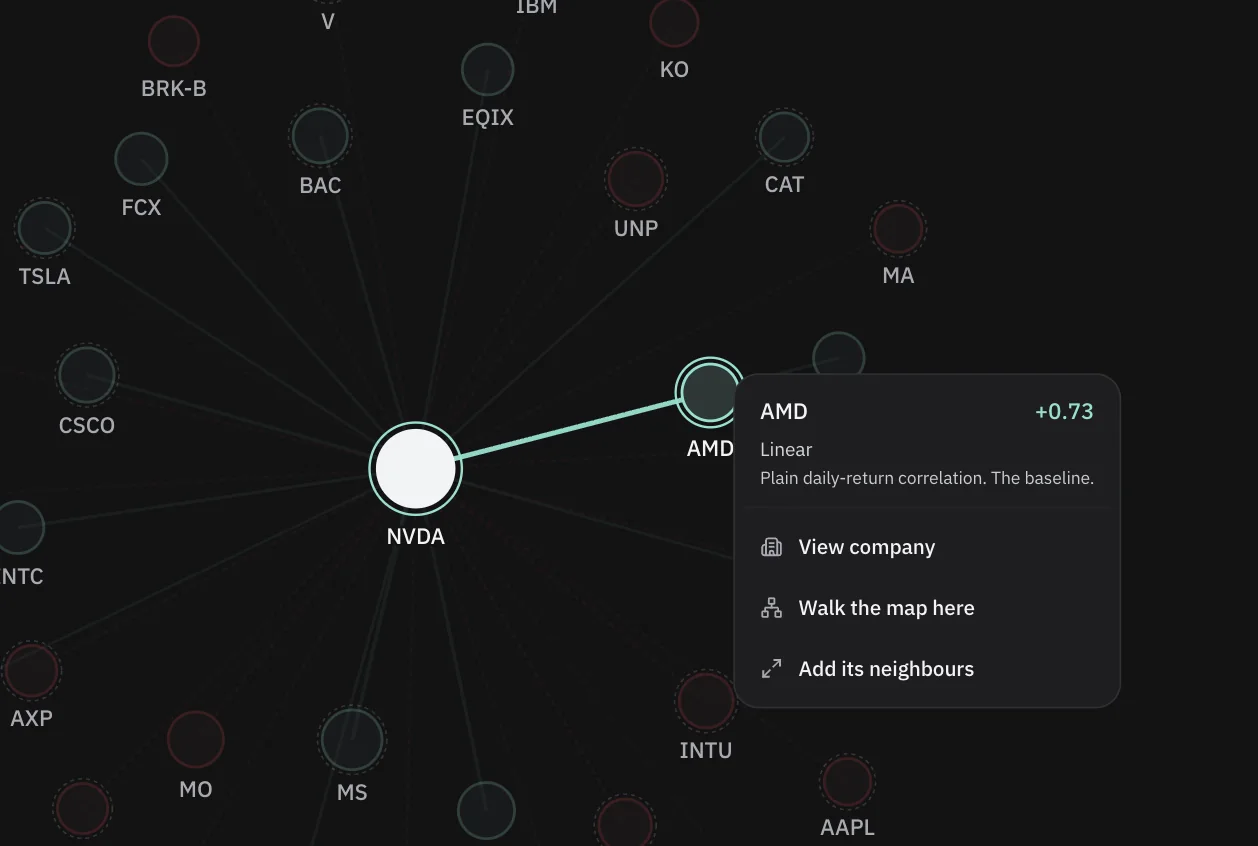
  • Nodes move liveAttracting and repelling as correlations shift. A neighbour on the Correlation Map with its correlation, the method that found it and its actions Nodes move live
  • The risk a table hidesWhen half a portfolio is the same bet, written three different ways. Placeholder · Video or photo The risk a table hides
Correlation Map, board view: what moves with a stock on the right, what moves against it on the left
Features

Everything Inside Market Maps

The full toolkit, built for speed and clarity.
See It in Action

Take Your Seat at the Desk

Join the traders who start every session with NNT. Your edge is one signup away.

Get Started
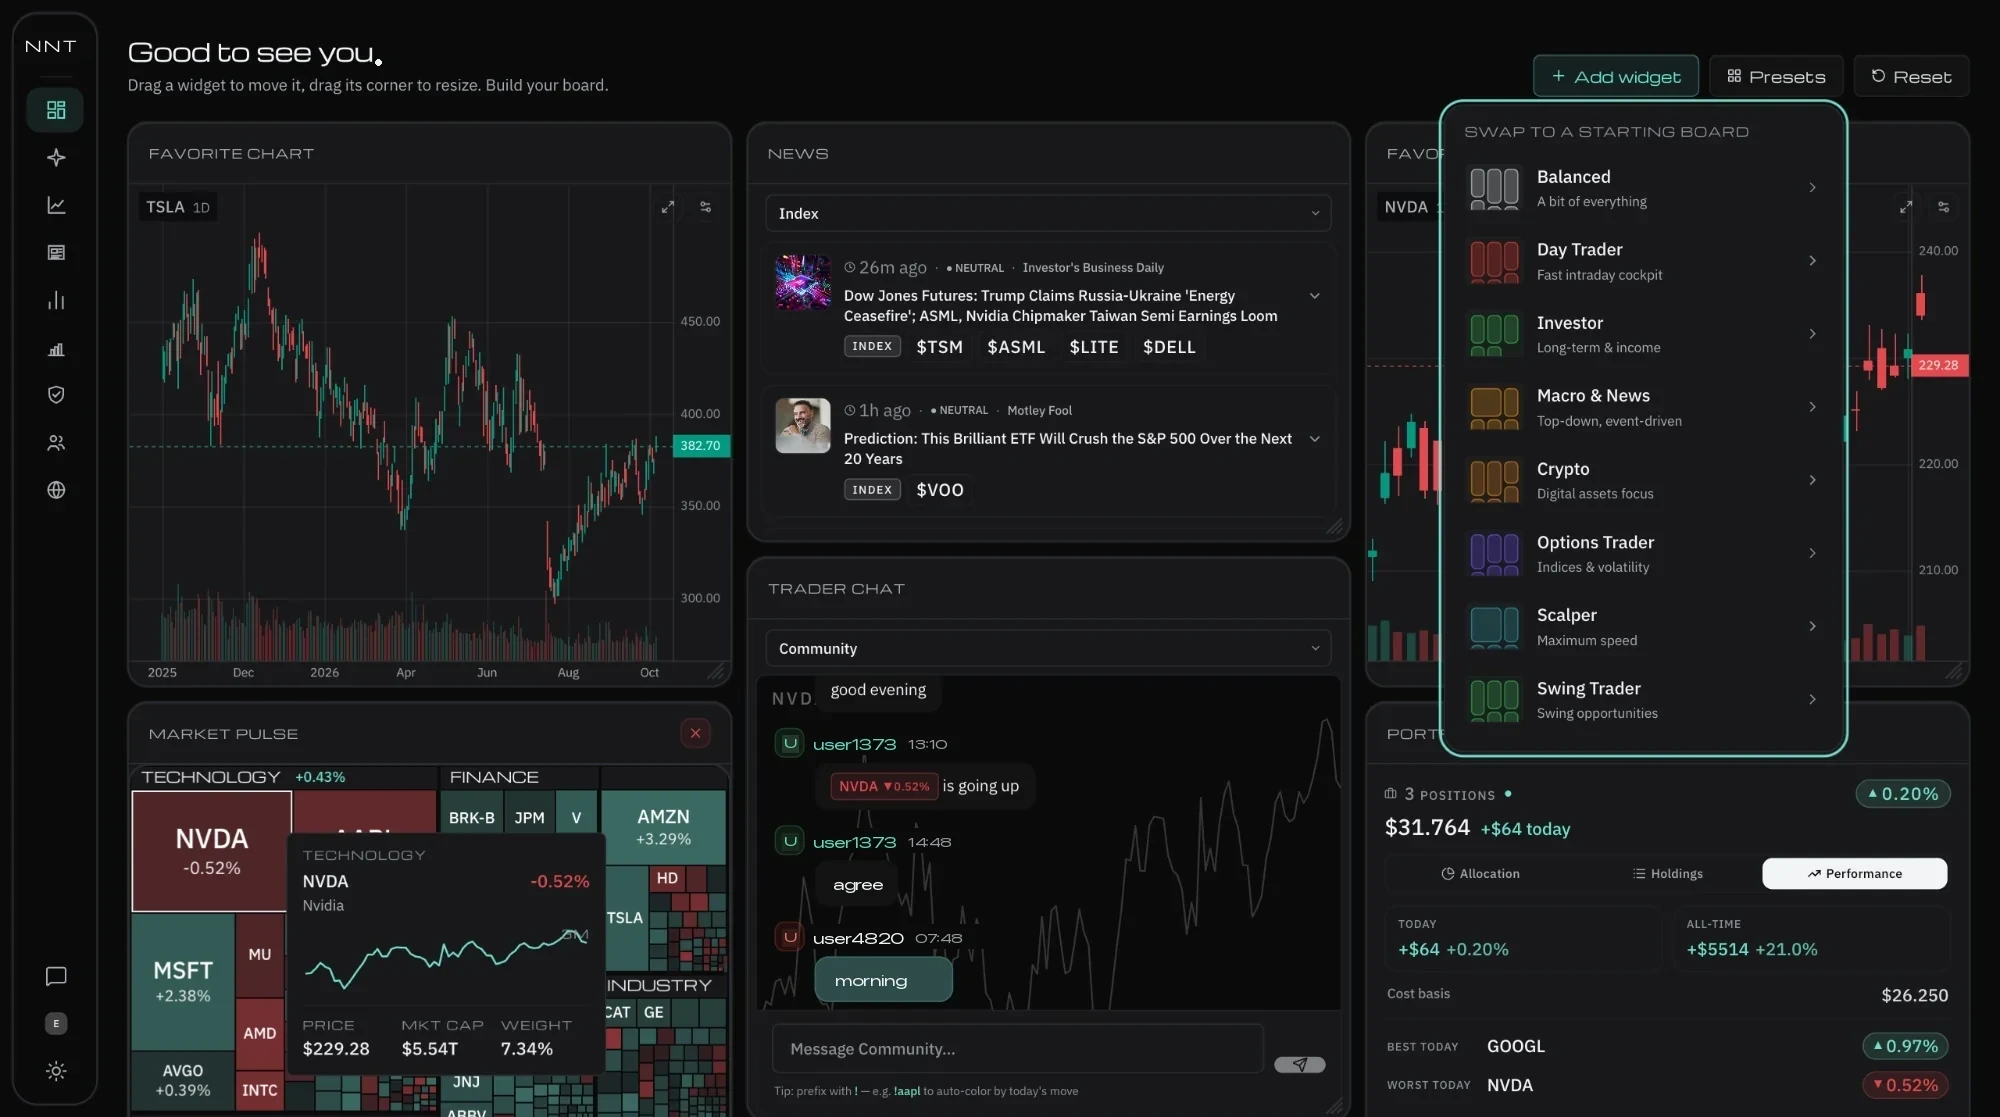
The NNT dashboard: market heatmap, live TV and the news column side by side
Placeholder · Screenshot dashboard NNT

← Back to home